A Decentralized Facility-Location Optimizer That Solves 11× More Scenarios Than the Textbook MILP
Priority-queue capacity handling + Progressive Scenario Expansion; on the real Dresden Gymnasium-location dataset it solves 14 schools × 558 students × 110 scenarios in 24 hours, where the textbook MILP stalls beyond 10 scenarios
Where do you put the next school, the next charging station, the next showroom? Traditional facility-location models assume a central planner assigns customers to facilities. Real customers don't take orders, they choose. We brought that observation into the heart of the optimization.
Our framework integrates rich discrete choice demand and capacity constraints (handled via decentralized priority queues) into a single MILP, plus a Progressive Scenario Expansion solver that handles 14-location, 558-customer, 110-scenario instances of a real Swiss school-location dataset, instance sizes the textbook MILP can't touch above R = 10 scenarios.
The challenge
The Capacitated Facility Location Problem (CFLP) is one of OR's classics, but classical formulations centralize the customer assignment, the operator decides not just where to open facilities but who goes where. That's fine for warehouses and distribution centers; it's wrong for any setting where individuals choose freely (schools, retail, EV charging, healthcare). Plug a centralized model into the school-allocation problem and the optimizer routes children to whichever school maximizes the planner's objective, even if the child would never go there.
Fixing this requires three things at once: rich discrete-choice demand on the customer side (which kills closed-form choice probabilities and forces simulation), capacity constraints expressed at the individual scale (which couple every customer to every other via the priority queue), and competitor-aware market-share thinking. Putting all three into a single tractable MILP, and solving it on real-world instances, was the open challenge.
Our approach
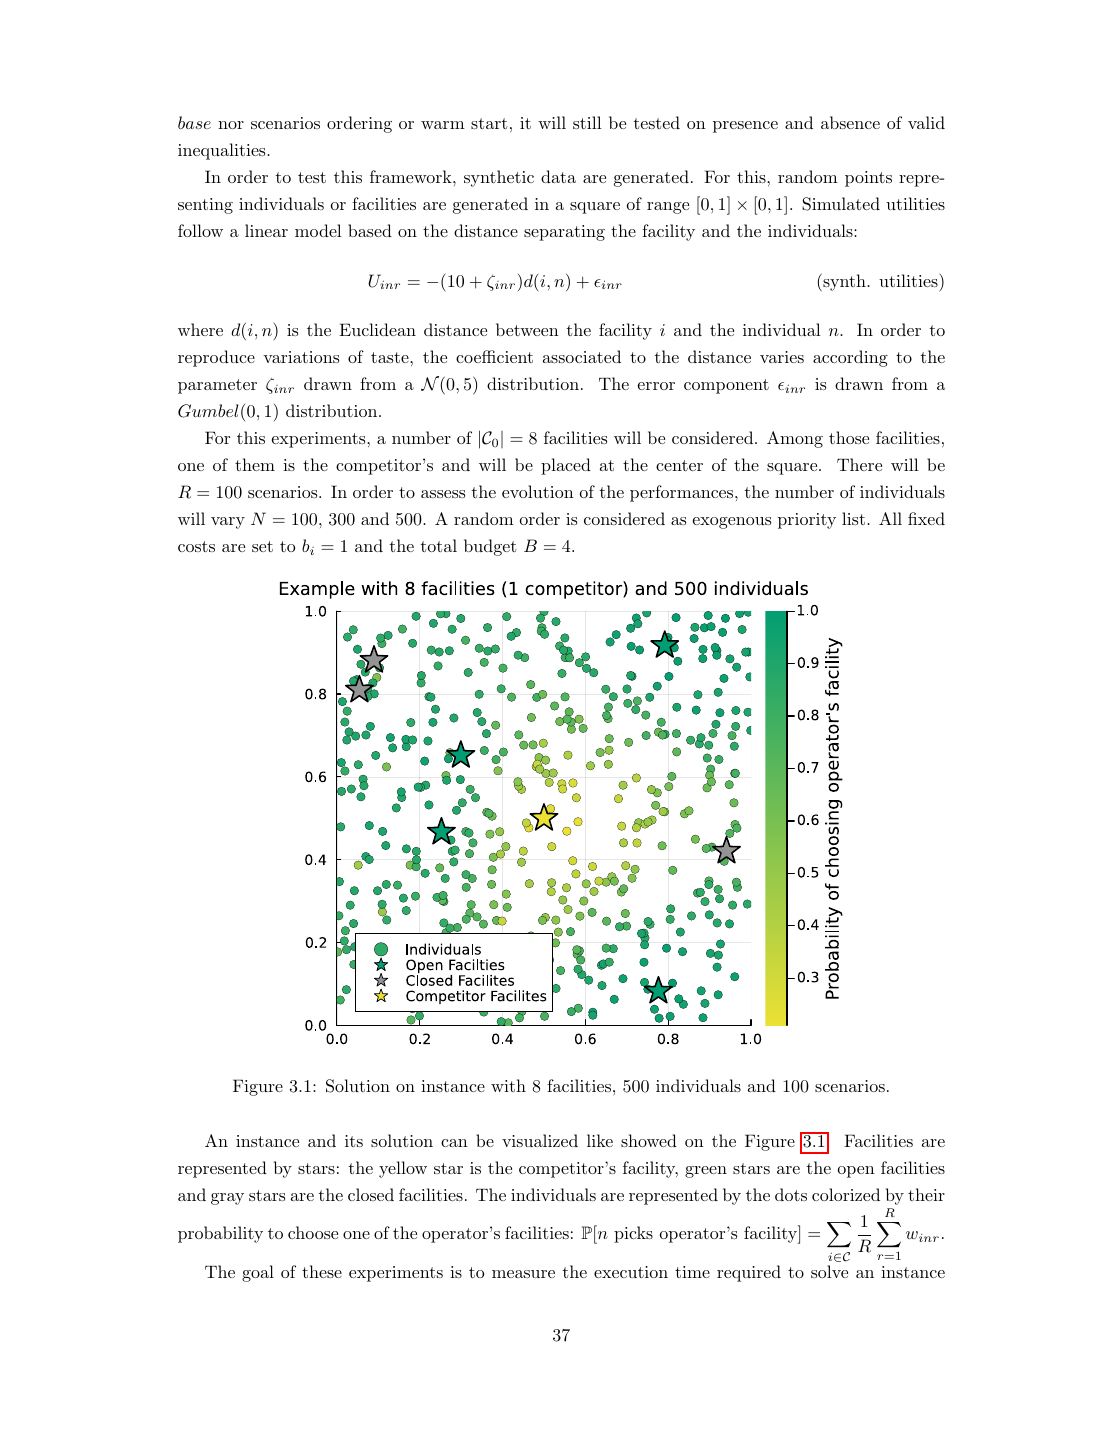
We adapted the simulation-based MILP framework of Pacheco-Paneque et al. from pricing to the CFLP context, turning each Monte Carlo scenario into a deterministic choice trajectory and aggregating market capture (the share of individuals who actually choose one of the operator's facilities) as the objective, instead of the centralized utility-sum that distorts the assignment.
Capacity is enforced through exogenous priority lists: each individual is processed in queue order, and a facility's availability variable y_inr flips to 0 the moment its cumulative selections reach capacity c_i. This decentralizes the assignment decision while keeping the formulation linear via discounted-utility tricks.
We added two valid inequalities (priority chain effect and aggregate capacity-budget linkage), a utility-preprocessing pass that eliminates dominated facility/individual/scenario tuples up front, and a Progressive Scenario Expansion (PSE) method that solves a sequence of nested sub-problems with geometrically growing scenario sets, warm-starting each from the previous. The base-1.7 growth rate, combined with priority-inequality + complete-warm-start + extended-entropy scenario ordering, is the winning configuration.
The outcome
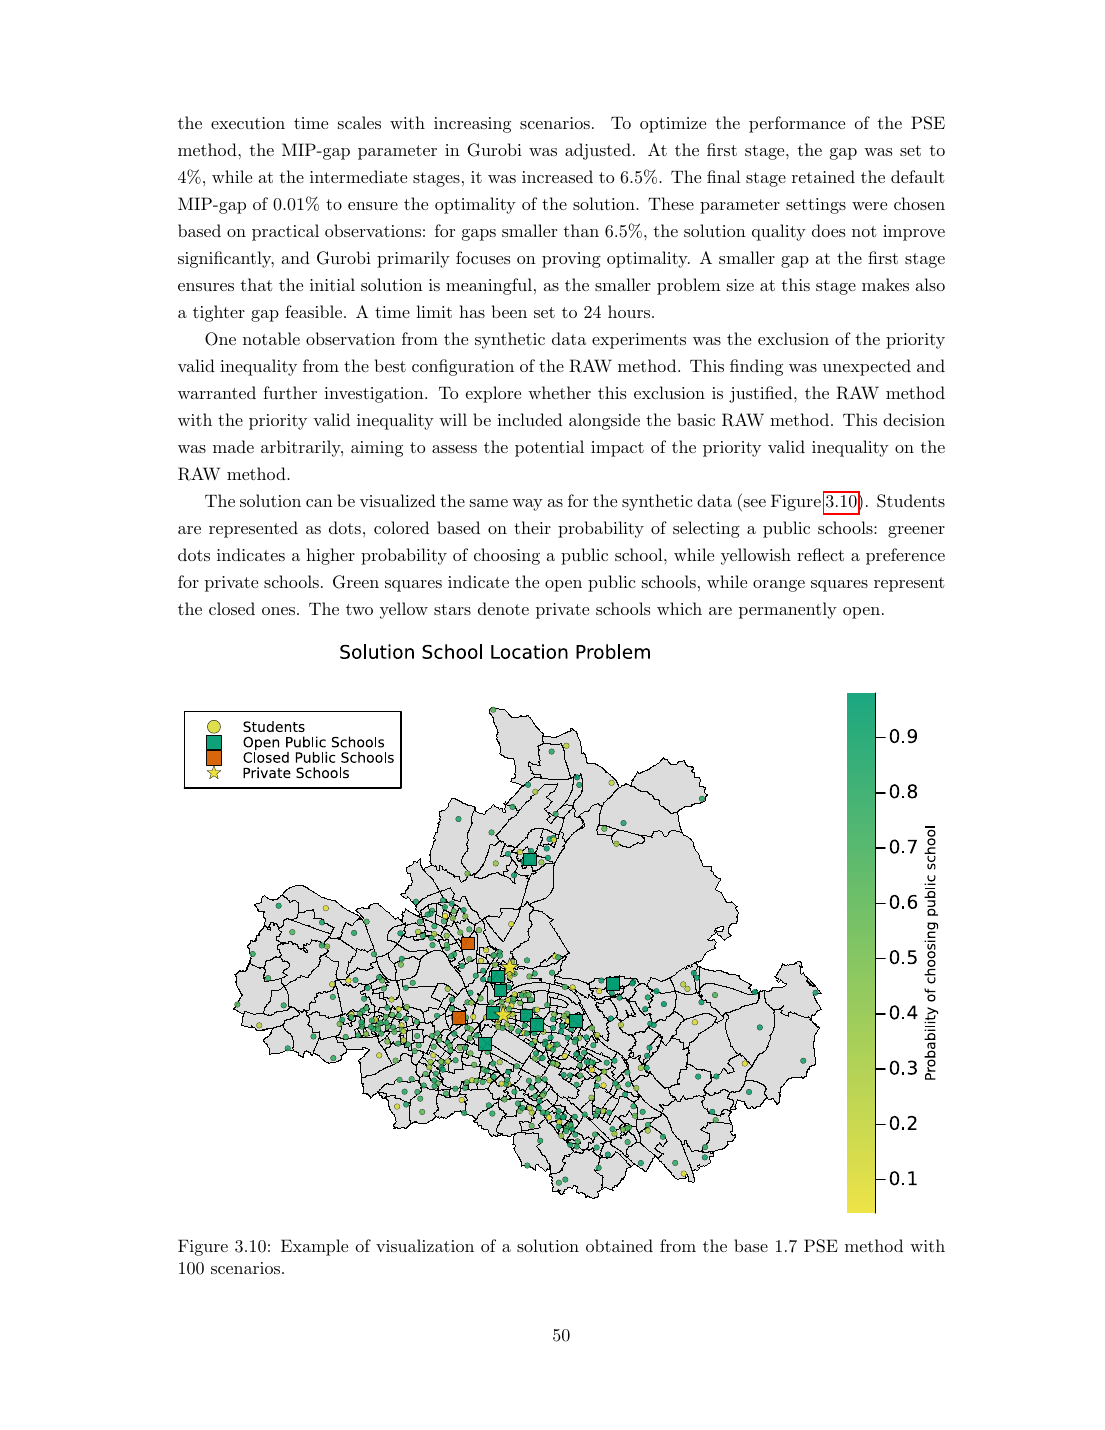
Deliverable: a decentralized capacitated facility-location framework that integrates any advanced discrete choice model into the MILP, plus a Progressive Scenario Expansion (PSE) solution method that scales it well beyond the textbook MILP. On the real Dresden Gymnasium-location dataset (Haase and Müller 2013, 14 candidate schools = 12 public + 2 always-open private, €6M budget), the best-configured PSE solves instances of up to 14 schools × 558 students × 110 scenarios within a 24-hour limit. The textbook RAW MILP stalls beyond 10 scenarios on the same instances — an 11× increase in solvable scenario count.
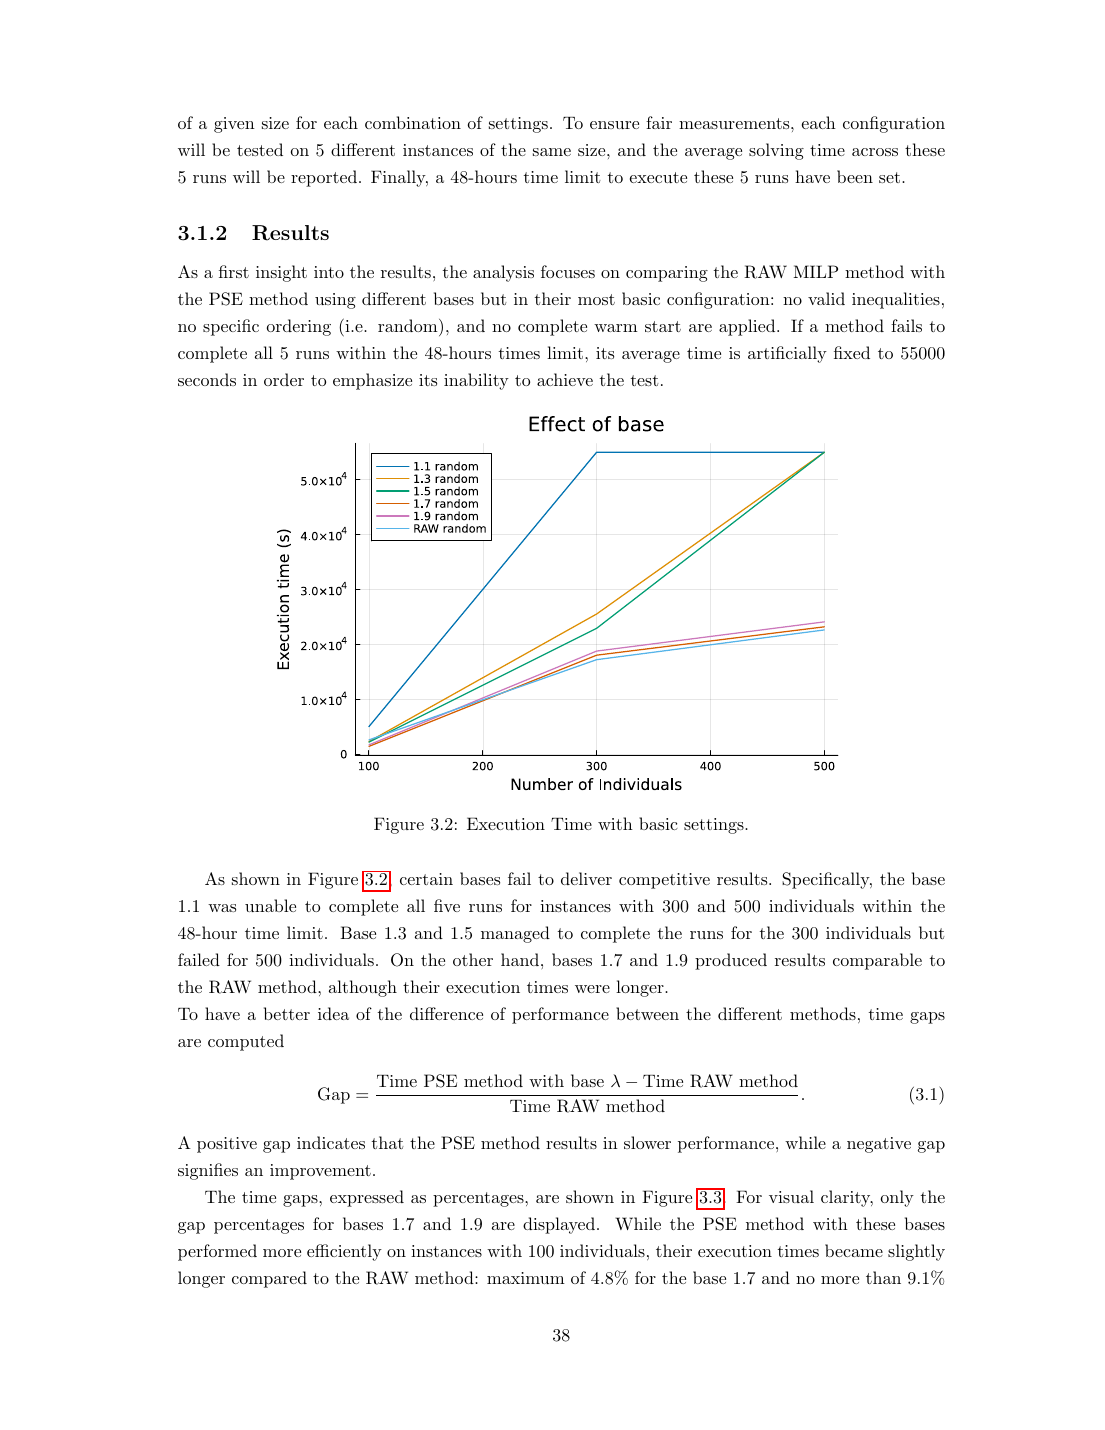
On synthetic data the best PSE configuration (base 1.7 + priority valid inequalities + complete warm start + extended-entropy ordering) achieves up to 95% runtime reduction versus the basic configuration, and 28% reduction versus the RAW MILP on instances both can solve. The priority valid inequality alone delivers 40–60% speedup; the rest comes from scenario expansion + warm-starting + entropy-based ordering.
Technical deep dive
The model behind the result.
The model
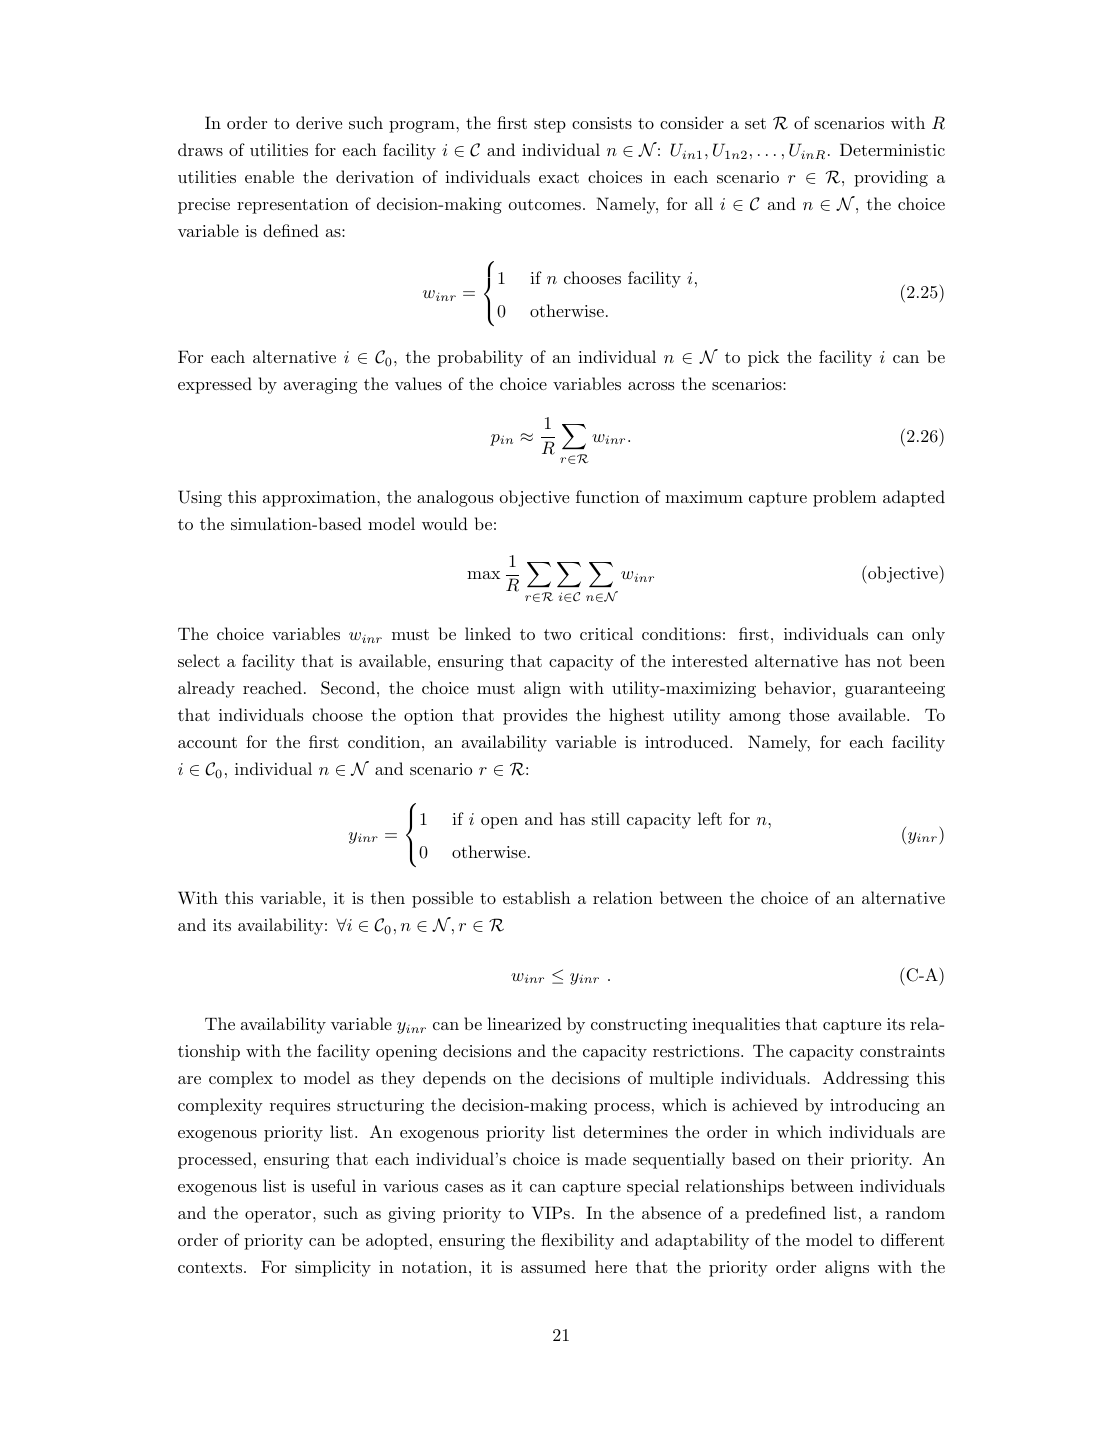
The whole trick of this work is to encode three coupled things in one MILP: who is choosing what (discrete-choice utility maximization at the individual scale), who gets in (priority-queue capacity dependency between every pair of customers), and where to place facilities (the strategic decision). The model lives in a Sample Average Approximation framework, we draw R Monte Carlo scenarios of the random utility terms, fix everything inside each scenario, and let the binary choice variables w_inr propagate through availability and capacity constraints. The result is a fully linear formulation that captures decentralized customer behavior without ever computing a closed-form choice probability.
Maximum-capture objective. Sum over scenarios, facilities, and individuals of the binary choice variable w_inr (1 iff individual n picks operator facility i in scenario r), normalized by 1/R. Each customer picks exactly one option (operator facility or competitor opt-out 0). Total opening cost subject to budget B. This is the decentralized analogue of the classical CFLP, the operator chooses facility openings y_i; customers choose facilities w_inr.
Discounted utility z_inr. To enforce that customers maximize utility *only over available facilities*, we mask the utility of unavailable options by replacing them with a constant L below any feasible utility value. The customer then picks the alternative with the highest discounted utility, which by construction is only ever an available facility. Big-M linearization handles the conditional definition.
Priority-queue capacity constraints. (A-O) Availability requires the facility to be open. (CAP1) Cumulative selections of facility i by all higher-priority customers (m = 1, …, n − 1) can't exceed c_i − 1 if facility i is still available to n. (CAP2) If facility i is open and not yet full when n arrives, it *must* be marked available, which prevents the solver from artificially closing a facility to a customer just to improve the centralized objective. (CAP2) is what makes the framework genuinely decentralized rather than a relaxation.
Priority-chain valid inequality. If facility i was available to customer n and customer n didn't take it, then it must still be available to customer n+1. This is the inequality that buys 40–60% runtime improvement on its own, it tells Gurobi about a structural relationship between consecutive availability variables that the original formulation leaves implicit. Without it, the solver re-discovers this from scratch at every node.
Utility preprocessing. For each (i, n, r) tuple, compute lower and upper bounds on the operator's utility versus the best alternative. If the operator dominates the competitor over the entire feasible range, the customer is captured deterministically, eliminate the tuple's choice variables and add the contribution as a constant to the objective. Symmetrically, if the competitor dominates the operator over the entire range, the tuple is never captured, drop it. Both directions reduce model size before the solver ever starts.
Progressive Scenario Expansion. Instead of solving the full MILP with R scenarios from the start, solve a sequence of nested subproblems where the scenario set grows by a fixed multiplicative factor λ. Each subproblem warm-starts from the previous one. The growth rate λ = 1.7 was identified empirically as the sweet spot: large enough to terminate in a reasonable number of stages, small enough that consecutive subproblems share enough structure that the warm-start carries real information. λ = 1.1 dies in stages; λ ≥ 2 loses the warm-start advantage.
Extended-entropy scenario ordering. To pick which scenarios enter the active set first, we cluster scenarios by their realized choice pattern and rank them by the entropy of cluster membership, high-entropy scenarios go first because they carry the most information about the choice landscape. Random ordering, by contrast, often spends the first few stages on near-duplicates of each other, wasting the early warm-starts.
The PSE + valid inequalities + utility preprocessing stack is what turns a textbook MILP into a tool that can actually solve realistic facility-location instances under decentralized customer choice. None of the four ingredients alone is sufficient, the RAW method with just priority inequalities can solve 10 scenarios; PSE without priority inequalities is slower than RAW; PSE with all features is the only method that breaks 50 scenarios on the school-location dataset. The headline limit (14 schools × 558 students × 110 scenarios in 24 h 57 min) is still well short of the original 26-school × 1,343-student dataset, which the thesis flags as the natural next research direction, likely via the heuristic methods being developed in the related BHA / BHAMSLE line of work.
Benchmark
Test on the Haase and Müller (2013) Swiss school-location dataset: 14 candidate schools (12 public + 2 always-open private), real cost and capacity per school, real student distributions and choice profiles. Times in seconds; 24-hour time limit (86,400 s). Each method tested with its 'best' configuration: RAW + priority inequality; PSE with base 1.7 + priority inequality + complete warm-start + extended-entropy ordering. "DNF" = did not finish within 24 h.
| Scenarios R | RAW + Priority VI | PSE base 1.7 (Best) | PSE 1.7 / RAW ratio |
|---|---|---|---|
| 1 | 35 s | 49 s | 1.40× |
| 5 | 444 s | 1,312 s | 2.95× |
| 10 | 3,861 s | 4,511 s | 1.17× |
| 50 | DNF (> 86,400 s) | 7,936 s | 0.09× (PSE 10× faster) |
| 100 | DNF (> 86,400 s) | 21,530 s | 0.25× (PSE 4× faster) |
Two regimes. Below R ≈ 10 scenarios, the RAW MILP wins, there's no point in scenario expansion when the full instance is already small. Above R ≈ 10 the RAW MILP collapses (the variable count grows as J × N × R and Gurobi's branch-and-cut can't keep up with the per-scenario combinatorics), and the PSE method is the only thing that finishes. The 50-scenario regime is the crossover where PSE goes from 'slower' to 'the only option that works', and it's exactly the regime that practical simulation-based facility-location problems need (the literature typically requires 100–1,000 scenarios for stable choice-probability estimates). On synthetic data with controlled instance size, the PSE 1.7 best configuration runs 85–95% faster than its own basic configuration (no inequalities, random ordering, partial warm-start), showing that every feature in the stack contributes.
From the record
Techniques
- Decentralized capacitated facility location
- Simulation-based MILP (SAA)
- Discrete choice with competitors
- Progressive Scenario Expansion
- Priority-chain valid inequalities
- Entropy-based scenario ordering
Stack
- Julia
- Gurobi 10.0.1
- Swiss school-location dataset (Haase & Müller 2013)
A problem like this?