FOPH (Federal Office of Public Health) · Public health decision support
Targeted Pandemic Restrictions That Cut ~22% of Infections at the Same Economic Cost
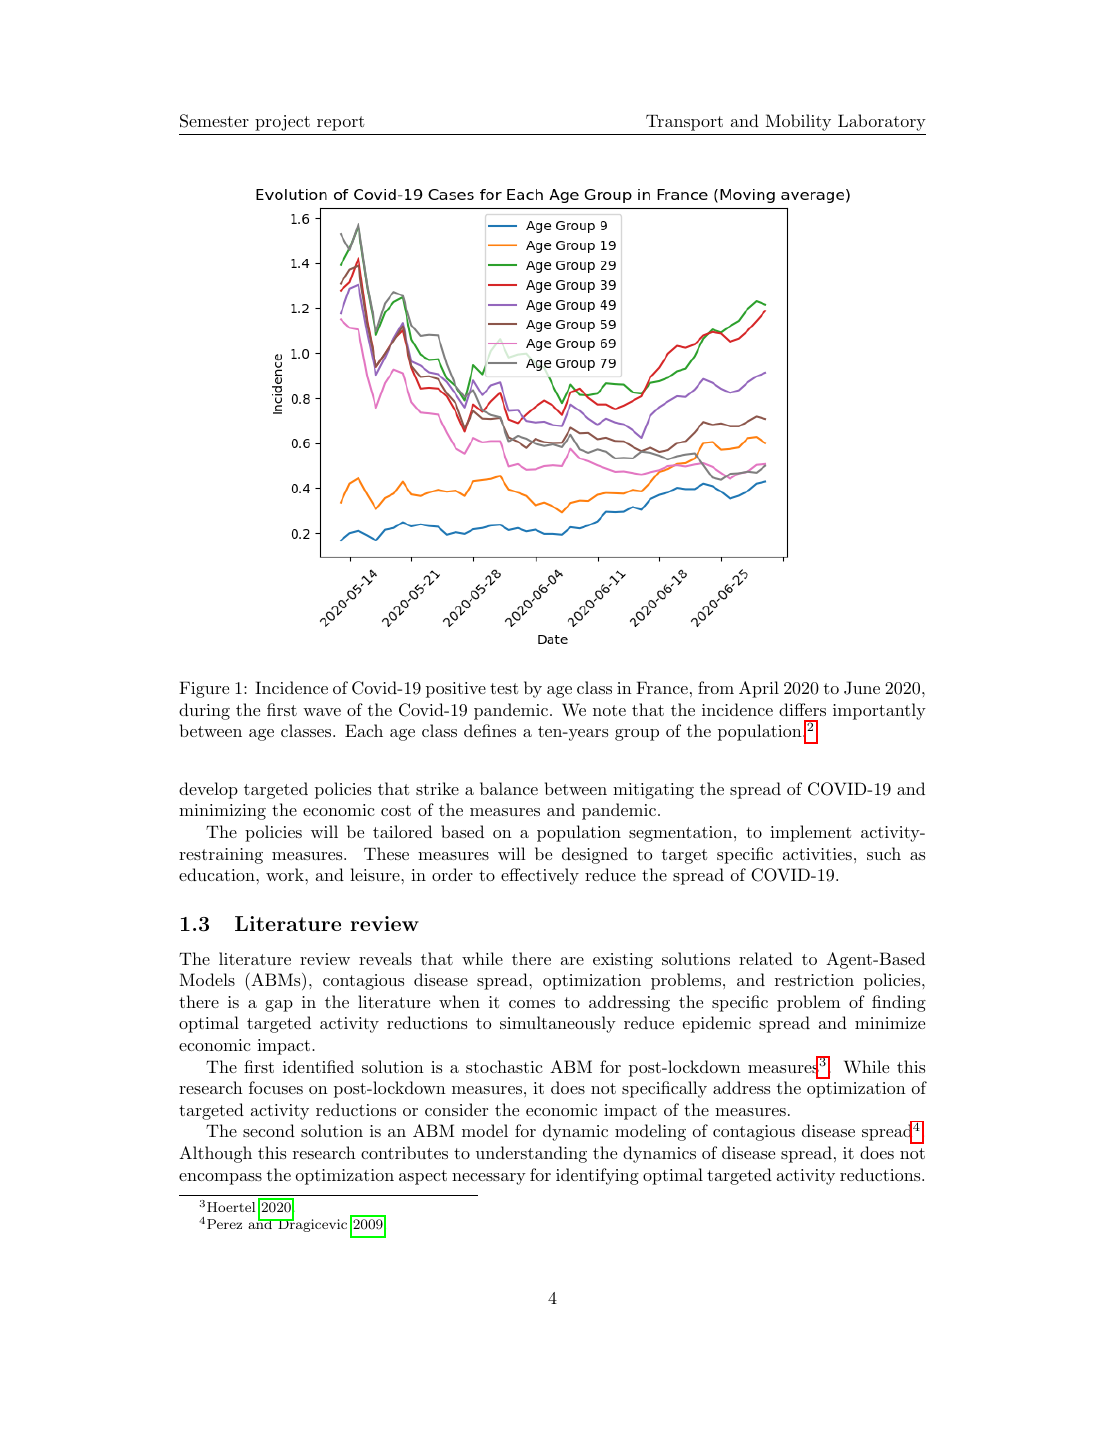
A 15-policy Pareto frontier of activity restrictions, computed end-to-end on the Vaud canton's 814,000-agent synthetic population — the kind of age-resolved policy decision a coarse SEIR model cannot deliver
Lockdowns work. They also crush GDP. The hard question, the one every government had to answer in the dark, is how to balance the two: which activities, for which age groups, in which regions, to restrict and by how much.
We built a methodology that turns that question into a multi-objective optimization problem. An agent-based simulator computes epidemiological outcomes; a variable-neighborhood search algorithm sweeps the policy space; the output is a Pareto frontier of restriction strategies, explicit trade-offs between health and economy that decision-makers can actually defend.
The challenge
Most pandemic models predict transmission. Few help you choose between policy alternatives. None of the existing literature combined an agent-based disease simulator with a proper optimizer that targets activity reductions while explicitly trading off health and economic costs.
Our partners needed a framework grounded in disaggregated activity behavior, work, school, leisure, shopping, and capable of producing a defensible policy menu, not a single point estimate.
Our approach
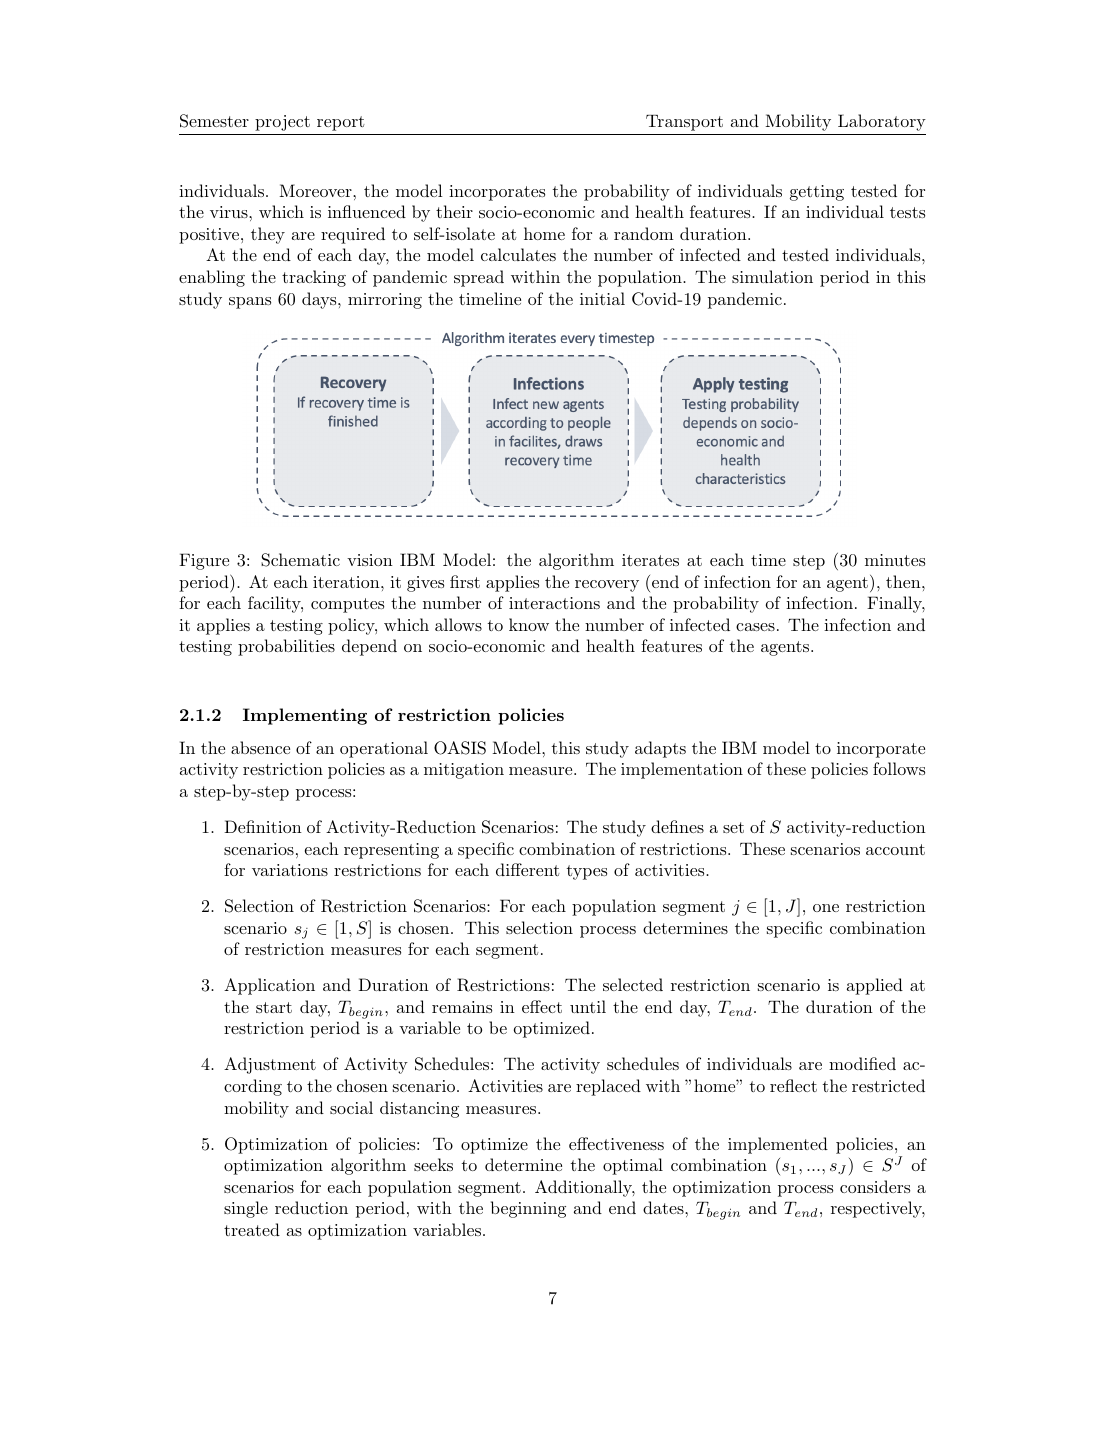
We modeled epidemic spread on a synthetic Swiss population using an Individual-Based / Agent-Based Model, with restrictions implemented as targeted activity-rate reductions per population segment (age, geography, socio-economic status).
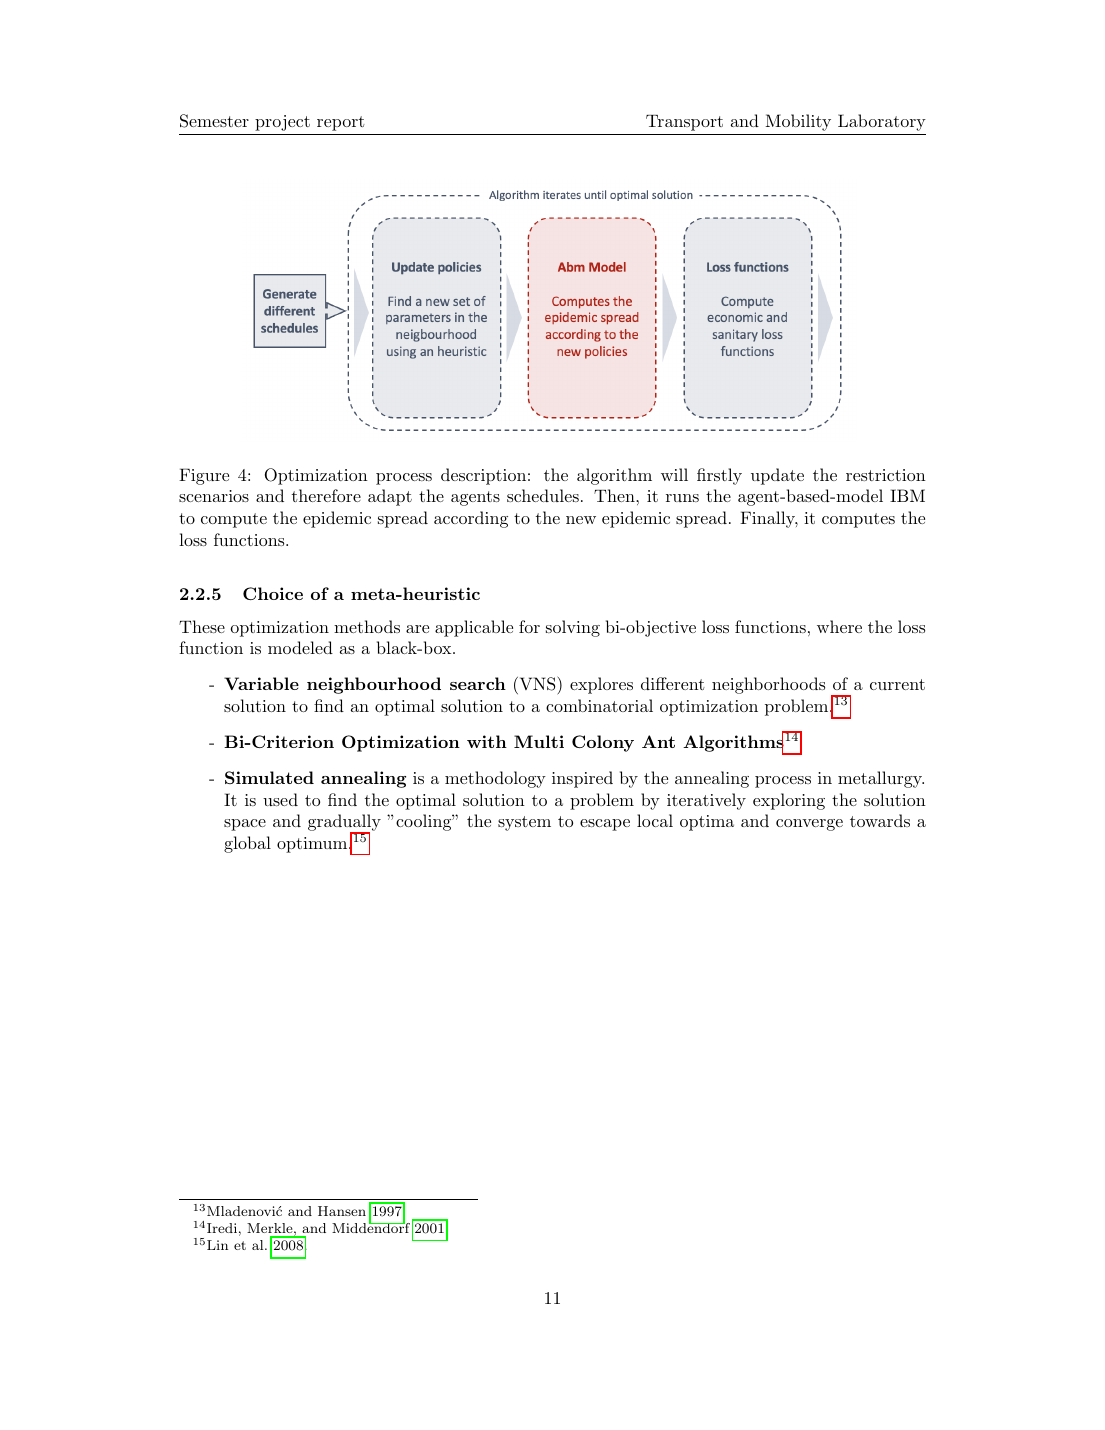
We wrapped the simulator in a Variable Neighborhood Search optimization loop, with two competing objective functions: a sanitary loss (cases plus weighted deaths) and an economic loss (cost of policies). VNS sweeps the policy space efficiently, escaping local optima that grid-search and gradient methods would lock onto.
The output is a full Pareto frontier of policies, each one a vector of activity-reduction parameters, plus the simulated epidemic curves backing every solution.
The outcome
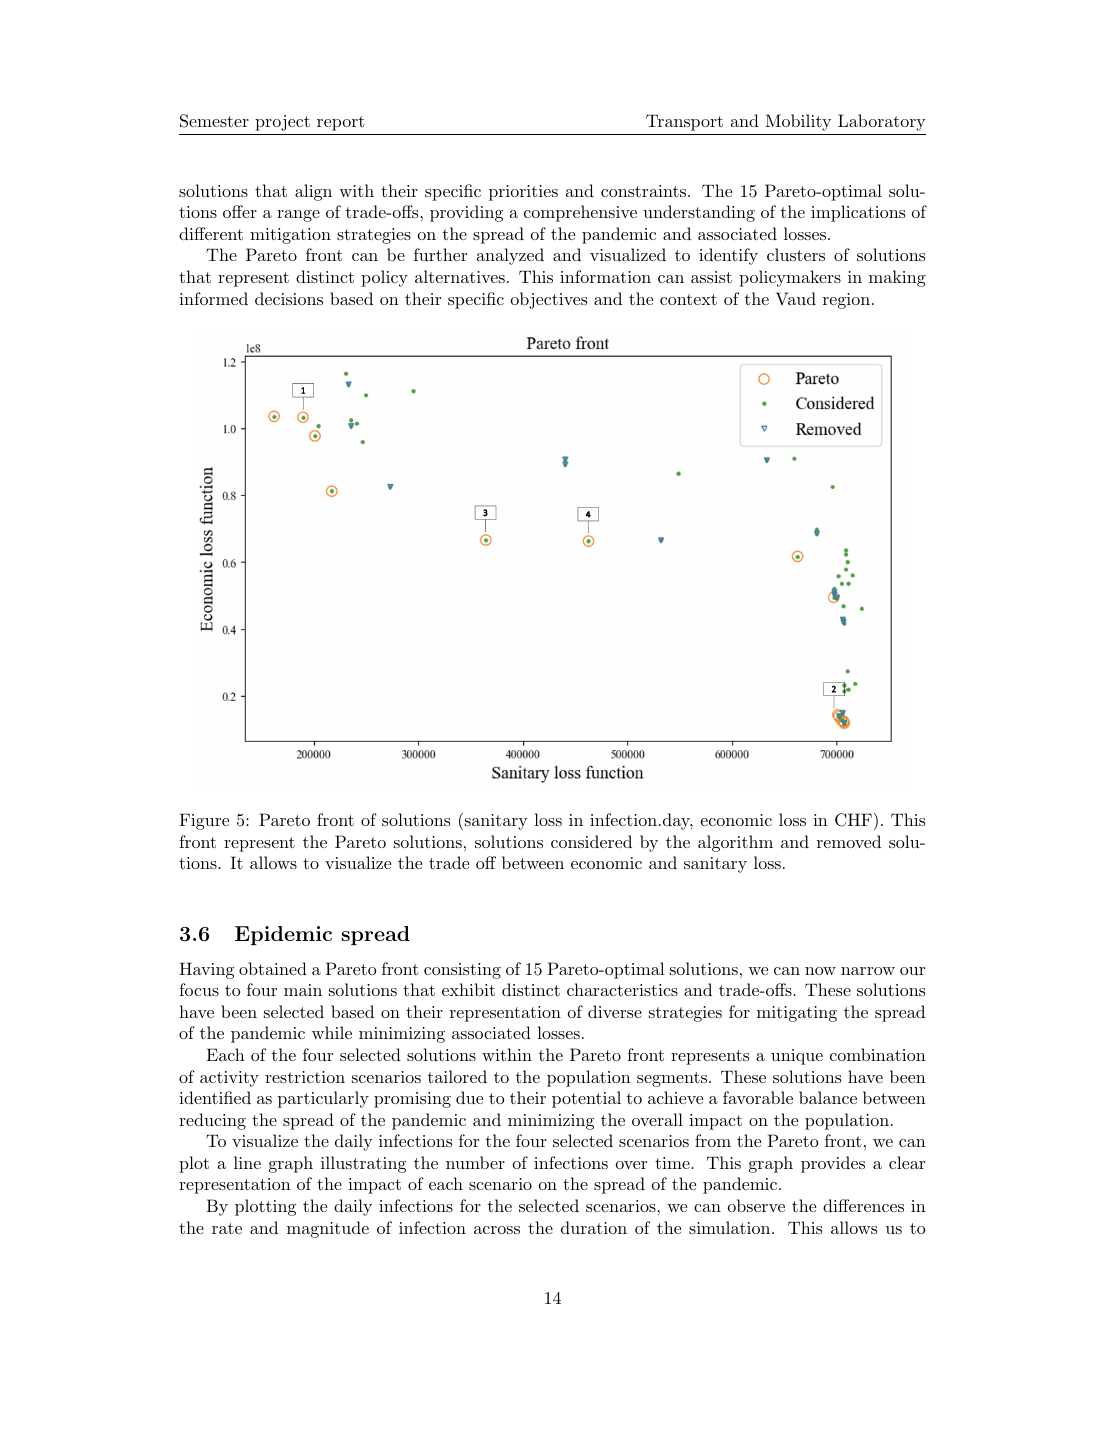
Deliverable: a 15-policy Pareto frontier of pandemic restrictions for the Vaud canton's 814,000-agent synthetic population, each policy paired with a full 60-day simulated epidemic trajectory. Computed by Variable Neighborhood Search wrapping a 30-minute-resolution individual-based simulator on the EPFL Jed server, in roughly 6 hours of wall-clock time.
The age-targeting finding: Solution 3 (restrict work for 30–39-year-olds, days 2–59) attains ~360,000 infected·days at 72M CHF. Solution 4 (restrict work for 40–49-year-olds plus a 20% restriction on 70–79-year-olds, same window) costs 4% less at 69M CHF but lets infections rise to ~460,000, roughly 22% more. Restricting the working-age cohort that actually moves through the workplace and commute layers of the simulator is materially more impactful than spreading restrictions across older cohorts — the kind of decision content a coarse SEIR model cannot surface.
Second deliverable: the methodology itself. Drop in a different pathogen's transmission parameters, swap activity definitions, and the same VNS-over-IBM loop produces a new frontier without rebuilding the work.
Technical deep dive
The model behind the result.
The model
The pandemic-policy problem isn't a single objective. It's two, and they fight each other: a sanitary cost (infections and deaths) and an economic cost (lost output from restrictions). The decision variables sit on top of a non-trivial population structure: J age segments and S discrete restriction scenarios, plus the start and end days of the restriction period. The simulator is a black box (an individual-based model run at 30-minute resolution over the Vaud canton's synthetic population), so the optimizer has to treat objective evaluations as expensive oracle calls and pick its policy moves carefully.
Decision variables. For each age segment j, pick one of S restriction scenarios; pick a single start day and end day for the restriction period over the T_sim-day simulation horizon. In our run: J = 9 age groups, S = 4 scenarios, T_sim = 60 days.
Bi-objective formulation. We don't collapse the two losses into a weighted scalar (anyone collapsing 'deaths' and 'francs' into a single number is making the value judgment, not the model). We trace the full Pareto frontier and let the decision-maker pick.
Sanitary loss. C_cas is the cumulative casualty count from the agent simulation; I_τ is the number of infected individuals on day τ; κ ≥ 0 sets the relative weight of infection-days against deaths. Both terms are outputs of the IBM black box.
Economic loss. α_i is the marginal cost (CHF / person / day) of restricting activity i ∈ A (work, education, leisure, shopping, …); H_i(s) is the total hours of activity i shifted to 'home' under the chosen scenarios; ε is the share of jobs that can't be done remotely and ψ the efficiency loss from those that can. Calibrated to the Vaud canton (GDP 62 Bn CHF, population 814 k, work cost 344 CHF / person / day).
Solution-space cardinality. Exhaustive enumeration is hopeless: at roughly 30 seconds of IBM simulation per policy evaluation, brute force would take on the order of 450 CPU-years. The 6-hour wall-clock we ended up running corresponds to a few thousand intelligent evaluations.
VNS neighborhoods. N^(1) increments or decrements the scenario for a single age segment; N^(2) shifts the start or end day by one; N^(3) translates the whole restriction period. VNS rotates between neighborhoods when stuck, which is how it escapes the local optima a coordinate-descent search would lock onto.
The full optimizer is the VNS loop wrapping the IBM black box: propose a policy in the current neighborhood, run the simulator, evaluate both losses, accept or reject by Pareto-dominance, and rotate neighborhoods on stagnation. Because every evaluation is expensive, the only sensible measure of efficiency is policy evaluations per Pareto point, which is why temporal moves matter (a single +1 day shift is cheaper-looking but often shifts the curve more than a scenario flip does).
Benchmark
Four representative solutions from the Pareto frontier (15 total), 60-day simulation on the Vaud canton's synthetic population (814 k agents, 9 age segments × 4 scenarios). Sanitary loss is reported in person-days infected over the horizon; economic loss is in CHF given the calibrated activity costs.
| Pareto solution | Sanitary loss (person·days) | Economic loss (CHF) | Targeted age group(s) | Restriction window |
|---|---|---|---|---|
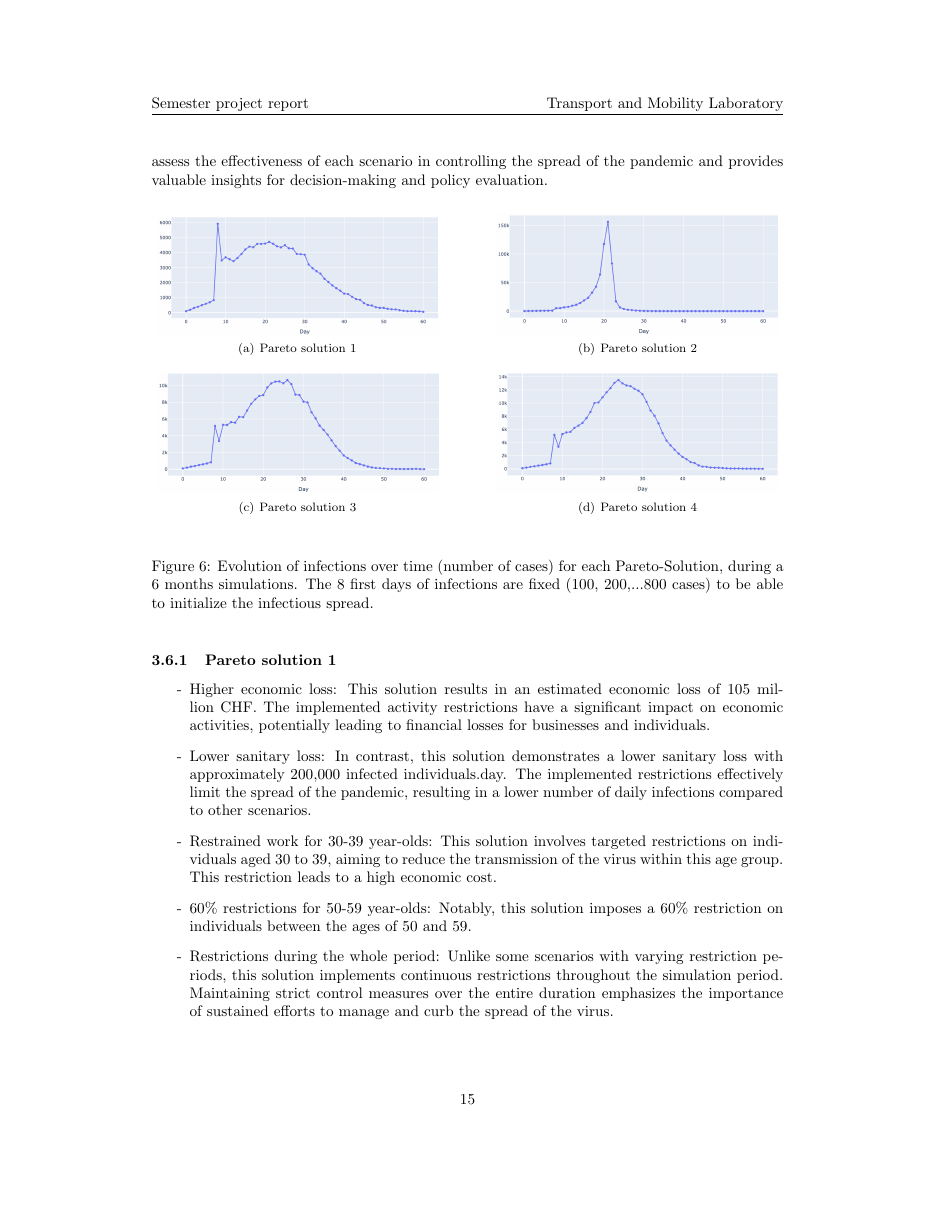
| 1, health-first | ~200,000 | 105 M | 30–39 (work), 50–59 (60% all) | full 60 days |
| 2, economy-first | ~700,000 | 15 M | 70–79 (light, non-working) | day 1 → 59 |
| 3, balanced | ~360,000 | 72 M | 30–39 (work) | day 2 → 59 |
| 4, balanced, shifted age | ~460,000 | 69 M | 40–49 (work), 70–79 (20%) | day 2 → 59 |
The frontier carries actual decision content. Compare solution 3 and solution 4: nearly identical economic loss (72 M vs. 69 M CHF), but solution 3 controls infections 28% better by restricting the 30–39 work cohort instead of the 40–49 one. That's the kind of detail a coarse SEIR model can't surface, because it doesn't know who is at which workplace at 10:30 on a Tuesday. The dominant pattern across the full frontier is that restrictions on the working-age population buy down sanitary loss most efficiently, while restricting the retired cohort buys down economic loss almost for free (because they're not contributing to GDP) but barely moves the infection curve.
From the record
Techniques
- Variable Neighborhood Search (VNS)
- Agent-based / individual-based modeling
- Multi-objective optimization
- Pareto frontier exploration
- Population segmentation
Stack
- Python
- Biogeme VNS package
- Individual-based simulator (IBM)
- MATSim activity schedules
A problem like this?